USGS and the National Weather Service publish real-time data on every earthquake, active volcano, flood alert, and stream gauge in the country. It's all public, but each agency's API speaks a different language. CronosPulse normalizes four of those feeds into one dashboard where the data is immediately readable.
Architecture
Each data area has a dedicated service class that handles the HTTP call, caches the response in Redis, and returns typed data objects. Nothing else in the app ever touches a raw API response. All external base URLs live in config and read from .env, so swapping an endpoint never requires touching application code.
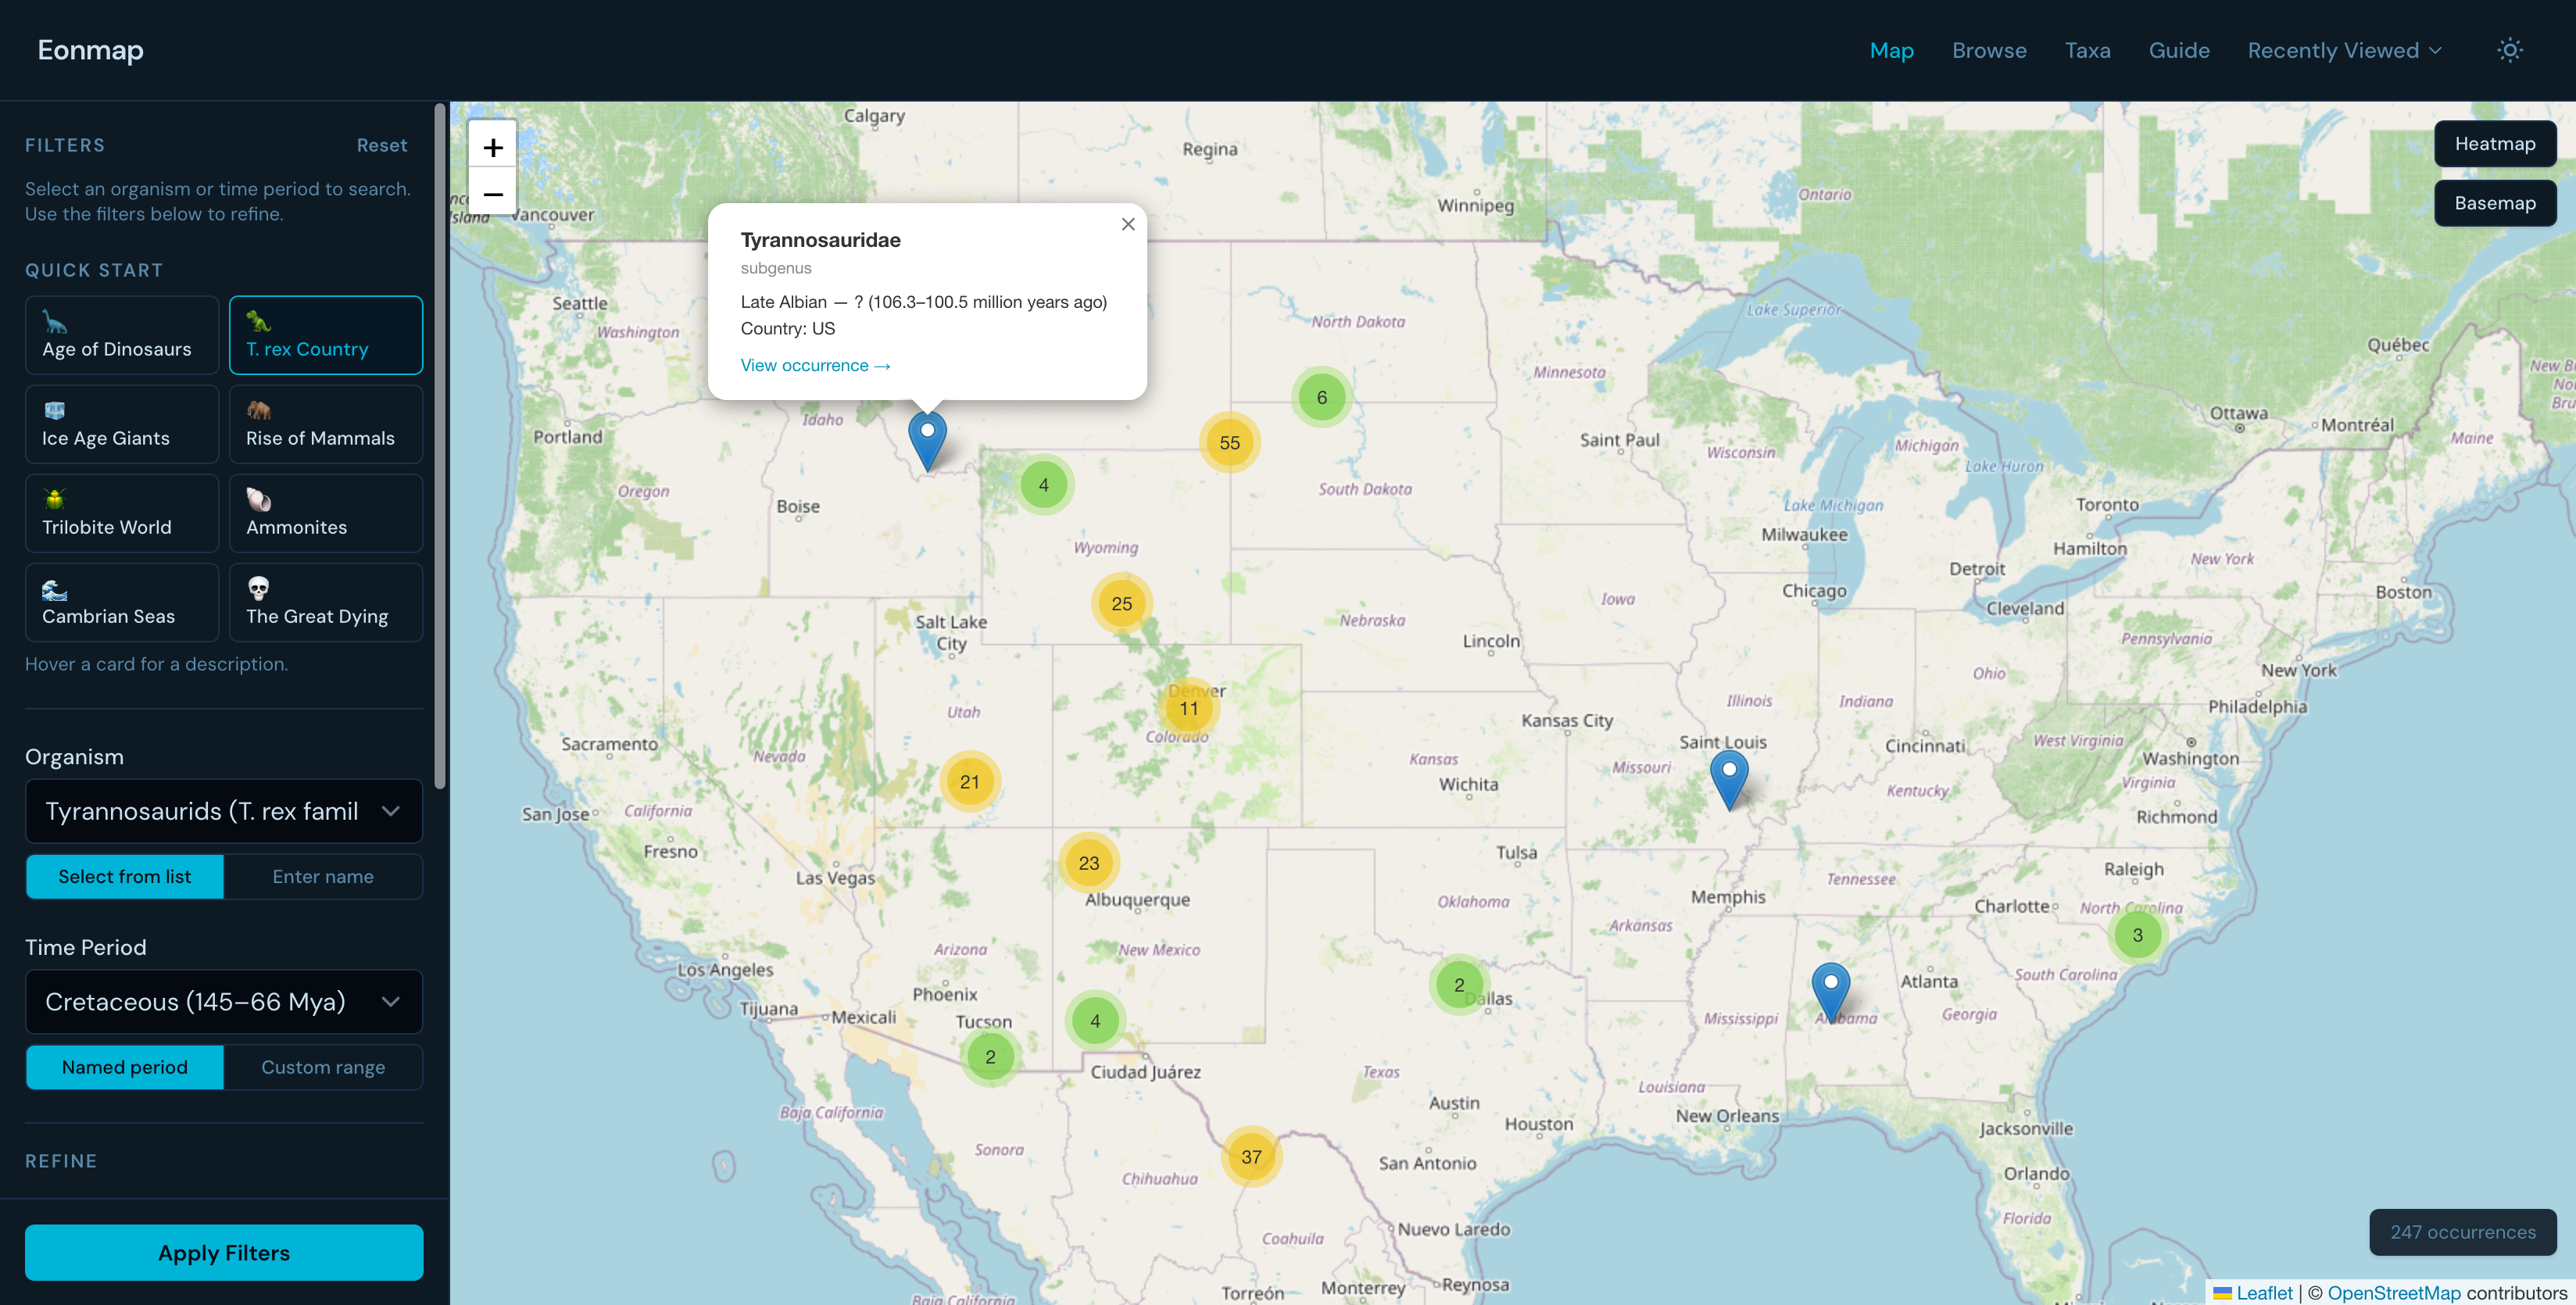
QuakeWatch
Users click anywhere on a Leaflet map to drop a pin, choose a radius and minimum magnitude, and get back a paginated table of matching USGS earthquakes with magnitude, depth, PAGER alert level, felt reports, and the local time at each event's location.
That last detail was the interesting one. Displaying time in the earthquake's local timezone normally requires a geocoding API. CronosPulse uses tz-lookup instead, a JavaScript library that resolves coordinates to a timezone name entirely client-side. No API key, no round-trip, no cost.
Sorting and pagination happen entirely in memory. Results come from USGS already filtered by the user's criteria, get sorted on whichever column was clicked, and get sliced into pages. No database query involved.
VolcanoWatch
All USGS-monitored US volcanoes render on a Leaflet map alongside a filterable, paginated table. A doughnut chart shows the current distribution of alert levels. All filtering runs in memory, and the chart always reflects the filtered dataset rather than the full unfiltered set. Clicking a table row highlights the correct marker on the map instantly because markers are keyed by volcano ID, so no re-fetch is required.
HydroWatch
HydroWatch covers two related things: active NWS flood alerts plotted on a national map with clickable alert zone polygons, and USGS stream gauge readings for any selected state.
The flood alert filtering is strict by design. Without it, the NWS feed returns unrelated products like Wind Advisories alongside actual flood events. A hardcoded list of 19 specific NWS product types (Flash Flood Warning, Coastal Flood Advisory, Hydrologic Outlook, and others) is what gets shown. Products that have no map geometry appear in the list but are excluded from the map. Severity sorts via a lookup table rather than relying on feed order.
Stream Gauge Tracker
Selecting a state queries USGS for every active stream gauge in it. A state like Texas returns over 800 entries. The component groups them by site and merges streamflow and gage height into one card per station. Clicking a gauge loads a 3-day sparkline. The page auto-refreshes every 5 minutes.
The state cache TTL is set to match the poll interval exactly. Polls never hit the USGS API directly; they always serve from cache until the data is genuinely stale. Logged-in users can save a gauge to their dashboard, and saved gauges remember the state code so the link drops you back into HydroWatch with the correct state and gauge already open.
Leaflet Markercluster race condition
VolcanoWatch exposed a timing bug that was tricky to pin down. Markercluster fires animation callbacks asynchronously after markers are added. When a filter change triggers a Livewire round-trip, Alpine clears the old markers and adds new ones; Livewire's DOM diff may then destroy and recreate the component instance. If the animation callback fires after the map instance has been nulled out during that teardown, it throws a null reference error.
Setting disableClusteringAtZoom: 8 in the marker cluster options fixes it. At the zoom levels where filter re-renders are likely, clustering is disabled and no async animation callback fires. At lower zooms, the animation completes before any re-render can. The stream gauge map uses the same fix.
Reactivity model
Livewire owns server state and Alpine owns the DOM. They communicate through browser events. A map click triggers a Livewire search; after the server responds, the updated data gets dispatched back to Alpine to update the markers without an extra round-trip. All map containers use wire:ignore so Livewire's DOM diffing never touches them and Leaflet instances survive re-renders.
Theming
Dark and light modes use CSS custom properties, not Tailwind's dark: variant. Alpine reads the preference from localStorage on load and applies it by toggling a data-theme attribute on <html>. Tailwind's @theme inline block exposes the variables as utility aliases, keeping hex values out of component files entirely.